Dust events.
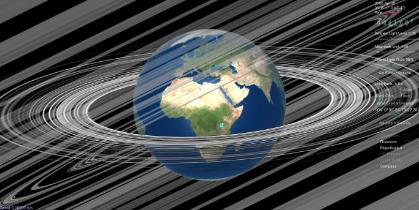
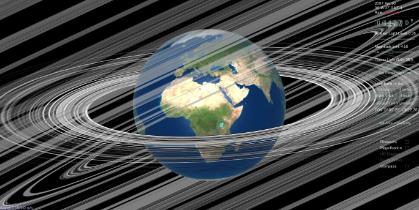
August 30, 2007. To the right, Celestia visualization. Below global aerosol data. Model of dust aerosol optical depth is to the left, measurement of aerosol optical depth at 550 nm is to the right (using Giovanni to visualize MODIS). Here: http://disc.sci.gsfc.nasa.gov/giovanni/overview/index.html
What I think is the model is different from measurement, and that the problems occur where the rings are. Where the ring shadows fall, there is more dust than the model expects. However, this is one instance and proves nothing. Let us try a few dozen more.
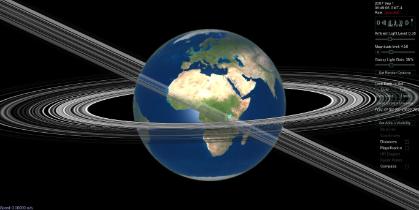
Same as above, but this time April 30, 2007. Still originating at http://gdata1.sci.gsfc.nasa.gov/daac-bin/G3/gui.cgi?instance_id=aerosol_daily
Next is April 30, 2006